Zachary J Baehr

A new content strategy and data analysis

In my second year at ‘Organization A’, we launched a new website designed to showcase the top needs of our audience with the great stories we were sharing. This also included an emphasis on being mobile-friendly, if not mobile-first. The results:

Content and Analytics 1

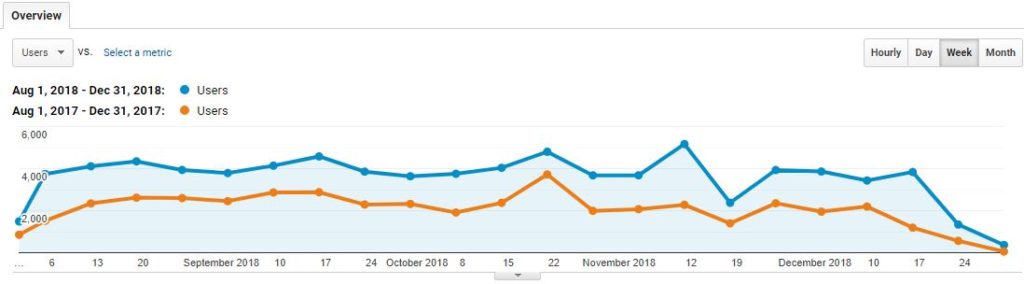
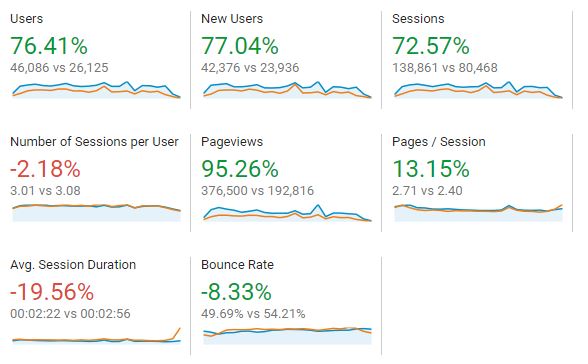
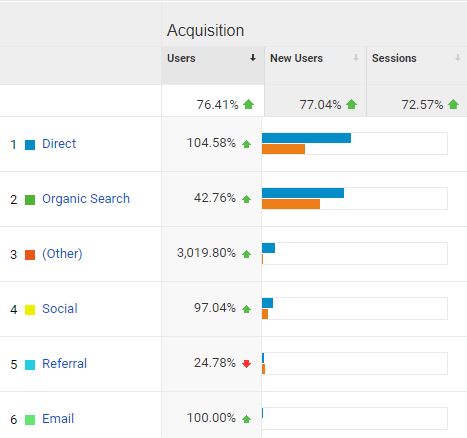
In six months we have seen dramatic growth in users and have been consistently drawing more viewers than the previous year. The numbers below also indicate positive trend-lines: More users, more often, more pages. And since we know viewers were looking at more pages overall, but were on the site less often, that likely means page speed was outstanding, or they quickly found what they wanted through better navigation, or both. (It also could be neither, but that’s not as likely).

Content and Analytics 2

Comparing year 0 (before changing our content approach) to year 1 (before the new web design) shows that improved content only has its limits. Since we also know our mobile numbers drastically improved from year 1 (poor mobile UX) to year 2, we can also deduce that great content can not overcome bad design.

Content and Analytics 3

These skyrocketing mobile (and tablet) views are a testament that good content and better design gave users a more complete experience. Not only did we add new content via storytelling, but we better structured existing content – items that didn’t change often but were still valuable – to better match user needs (determined by surveys and focus groups).

Content and Analytics 4

It should come as no surprise that better content with proper SEO tools would result in an uptick in organic search, though we hope our work pays off even more in the future.

Content and Analytics 5

We know social media success doesn’t have to involve a ‘click through,’ but occasionally it’s important to note how a solid piece of content on Facebook, for example, can drive attention to your website. Below are two sets of time periods, each about 18 months (before and after content strategy approach), showing the improvement in click-throughs from social media. It’s important to note the far right column, which shows the willingness of users to come for one story and stay around on the website for other content.

Content and Analytics 6

Sign up to receive these ideas in your inbox

* indicates required